Have you ever placed a trade, convinced the price was about to explode upward, only to watch it stall and reverse as if it knew you were there? You check the news—nothing. You check the charts—the pattern looked perfect. The Fibonacci levels aligned. The MACD crossed. So, what happened?
You got microstructured.
Beneath the surface of every candlestick chart lies a hidden battleground. It’s a world of high-frequency algorithms, iceberg orders, and liquidity grabs. This isn’t the realm of retail traders comparing RSI and stochastic oscillators; it is the domain of institutional order flow. These are the players moving millions of shares—or dollars—per second, and they don’t care about your trendline.
Welcome to the study of Market Microstructure. By the time you finish reading this guide, you will understand not just where price is going, but how it moves there, why it moves there, and most importantly—how to spot the footprints of the “Smart Money” before they drive price 100 pips in their direction.
For a foundational understanding of why conventional technical analysis misses these dynamics entirely, see our earlier post: 5 Reasons Why Technical Analysis Fails Most Traders (And What to Use Instead).
Part 1: The Big Lie—Why Price Isn’t What You Think It Is#
Most retail traders look at a price chart and see a single, definitive number. They think, “The stock is worth $150.23.” They treat that number as an absolute truth, a reflection of the asset’s intrinsic value at that precise second.
In reality, price is a conversation. Specifically, it is the midpoint of a negotiation happening right now between two parties: a desperate buyer and a greedy seller.
Market microstructure teaches us that there is no single “price.” There is a Bid and an Ask, and the space between them tells you everything about the market’s current mood.
The Anatomy of a Quote#
- The Bid (BID): The highest price that a buyer is willing to pay right now. If you want to sell immediately, this is the price you get.
- The Ask (ASK/Offer): The lowest price that a seller is willing to accept right now. If you want to buy immediately, this is the price you pay.
- The Spread: The distance between them. This is the cost of immediate execution.
Think of it like a pawn shop. You walk in with a gold watch. The owner offers you $50 (the Bid). You want $75 (the Ask). Until you agree, the transaction doesn’t happen. The price isn’t $50 or $75; the price is the tension between the two.
The market is the same. The price you see on your chart is simply the last place where a buyer and seller shook hands. It is history. It tells you nothing about the willingness of the next buyer or seller standing in line.
SEO Takeaway: Understanding the bid-ask spread explained is the first step to realizing that trading isn’t about predicting the future with indicators, but about managing the mechanics of execution and reading the tension between buyers and sellers.
The Spread as a Diagnostic Tool#
The width of the spread is a vital sign of market health.
- Tight Spread (e.g., $0.01): High liquidity, high competition. Institutions are active. This is a healthy, tradable market (like Apple or Microsoft during market hours).
- Wide Spread (e.g., $0.10 or more): Low liquidity, low volume. Institutions are absent. Trading here is dangerous; you are likely trading against other retail traders or market makers who will run you over. This happens during lunch breaks, pre-market, or with illiquid penny stocks.
By simply observing the spread, you can decide whether the opportunity is worth your time or if you are walking into a trap.
Part 2: Liquidity—The Invisible Ocean#
If microstructure is the engine of the market, liquidity is the fuel. When traders say a market is “liquid,” they mean there is a high volume of resting orders waiting to be filled at various price levels.
Institutional investors—the mutual funds, pension funds, and hedge funds that control trillions of dollars—cannot just click “buy” like you can. They face a massive constraint: Market Impact.
If a fund wants to buy 500,000 shares of Apple, and they slap the market with a single market order, they will eat through the Ask prices so fast they will drive the price up against themselves. They will end up buying the first 100,000 shares at $150, the next at $151, and the last at $155. They have just moved the price $5 against their own position. This is called slippage, and it destroys returns.
Therefore, institutions don’t seek price; they seek liquidity. They need a thick order book where they can hide their size.
Types of Liquidity#
- Visible Liquidity: Limit orders sitting on the public order book (Level 2 data). These are the bids and asks you can see.
- Hidden Liquidity: Orders that are not displayed on the public tape. This includes:
- Iceberg Orders: A large order broken into small, visible pieces. You only see the tip; the mass is hidden beneath the surface.
- Dark Pools: Private exchanges where institutions trade anonymously to avoid moving the market. A massive percentage of all institutional volume happens in the dark.
The Golden Rule of Microstructure#
Price moves when aggressive capital removes liquidity.
To understand this, you must understand the two types of traders:
- The Aggressive Trader (Taker): Uses Market Orders. They demand immediate execution. They say, “I don’t care what the Ask is, I want it now.” They remove shares from the order book.
- The Passive Trader (Maker): Uses Limit Orders. They provide liquidity. They say, “I will wait here until someone comes to me.” They add shares to the order book.
Institutions use sophisticated algorithms (like VWAP, TWAP, or Implementation Shortfall) to disguise their aggressive buying as passive limit orders. They want to be the Maker while they accumulate, so they don’t tip their hand. They only turn into Takers when they are ready to break through a key price level, creating the explosive moves that retail traders chase.
Part 3: The Institutional “Footprint”—How to Track the Smart Money#
So, if institutions are hiding, if they are using icebergs and dark pools, how do you possibly track them? You cannot see their exact card, but you can see the shadows they cast on the wall.
Institutions are massive. Even with the best algorithms, they cannot move billions of dollars without leaving a trace. Here are the three most reliable footprints left by institutional order flow.
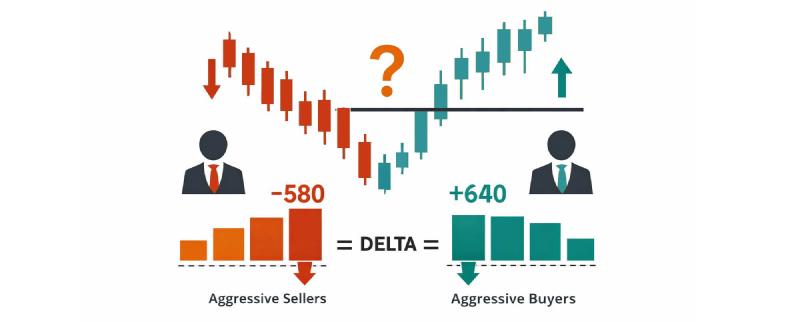
A. The Aggressive Imbalance (Delta)#
Volume Delta (or simply Delta) is the single most powerful tool in the microstructure arsenal. It is the difference between buying volume and selling volume.
- Delta = Volume traded at the Ask (Aggressive Buyers) - Volume traded at the Bid (Aggressive Sellers)
How to read it:
- Positive Delta: More aggressive buying than selling.
- Negative Delta: More aggressive selling than buying.
The Divergence Play: If price goes up, but Delta is negative (more sellers than buyers), that is a bearish divergence. It suggests that the move up was weak, likely driven by a lack of sellers rather than genuine buying pressure. It is an illusion, and it is likely to reverse.
Conversely, if price goes down but Delta is positive (buyers are stepping in aggressively), institutions might be accumulating the dip. Price is falling, but volume says smart money is buying.
Institutions cannot hide their aggression forever. When they finally decide to enter a position in full force, they need to fill huge size, creating a massive spike in Delta that retail traders often mistake for “FOMO” (Fear Of Missing Out). When you see Delta spike while price is flat, expect a move soon.
B. The Order Book Imbalance#
While Level 2 data can be spoofed by algorithms placing fake orders (a tactic called spoofing), a persistent and growing imbalance is a major tell.
- Scenario: There are 1,000 contracts on the Bid and only 200 on the Ask. The Bid is “stacked.”
- Interpretation: This wall of bids suggests there is a strong interest in buying at that lower price. It acts as magnetic support. If price approaches this wall and it holds, it confirms support.
However, the real information comes when the wall breaks. If aggressive sellers eat through that entire 1,000-contract wall in seconds, it signals a major shift in control. It means the “passive” buyers at that level have been overwhelmed and have no more capital. The path of least resistance is now down.
Institutions place these walls to “test” the market. If they put up a wall of bids and it gets eaten immediately, they know selling pressure is intense, and they will cancel their remaining orders and step aside.
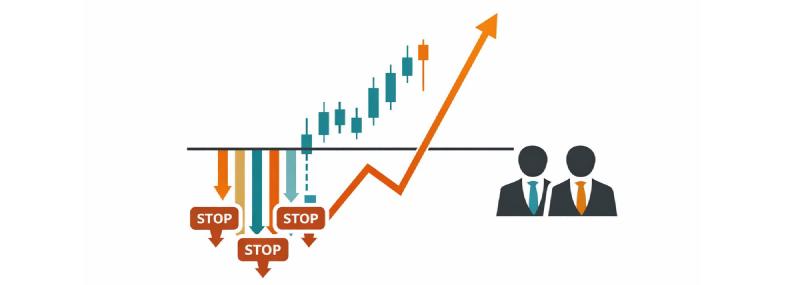
C. The “Spring” or Liquidity Grab (Stop Hunt)#
This is the signature move of market makers and algorithms. It utilizes stop-losses as a source of fuel.
Retail traders love to place their stop-losses just below the recent swing low (for longs) or just above the recent swing high (for shorts). Institutions know exactly where these clusters of liquidity sit. It’s not a secret; it’s basic human psychology.
To buy a large position without driving price up, institutions need to attract sellers. How do they attract sellers? They create panic.
- They push price down, breaking below a well-defined support level.
- This triggers all the retail stop-losses (generating a wave of selling pressure).
- The institutions, waiting just below the level, absorb all that cheap selling pressure like a sponge.
- With the sellers exhausted (all stops have been triggered), there is no one left to sell. The path of least resistance is up.
- They reverse the price aggressively upward, now holding a massive long position filled at a discount.
How to Spot It: Look for a wick through a level of support or resistance on high volume, followed by an immediate reversal and close back inside the range. You didn’t see a failed breakout; you saw an institution vacuuming up liquidity. In Smart Money Concepts (SMC), this is often called an “Inducement” or “Liquidity Sweep.”
Understanding these liquidity dynamics is essential for forming a falsifiable trading thesis. Learn how to incorporate stop hunts and order flow into your pre-trade analysis in The 3 Pillars of Professional Trading.
Part 4: The Venues—Where the Magic Really Happens#
To truly understand how institutions trade, you must understand where they trade. It is not all happening on the exchange you see on CNBC. The market is fragmented, and that fragmentation creates opportunity (and risk).
- Lit Exchanges (NYSE, NASDAQ, LSE): These are the transparent, public exchanges. All orders placed here are visible (to some extent) on the tape. High-frequency traders scalp pennies here.
- Dark Pools: These are private forums for trading securities, not accessible to the public. Institutions use them to cross large blocks of shares anonymously. If a pension fund wants to sell a million shares to a hedge fund, they can do it in a dark pool at a midpoint price, and the public will never see the order on the tape. This is why price sometimes seems to “gap” through levels; the transaction happened in the dark.
- ECNs (Electronic Communication Networks): Automated systems that match buy and sell orders, often displaying orders to the public (like ARCA or BATS).
The Smart Order Router (SOR)#
Why does this matter to you? Because if an institution wants to buy 1 million shares, they will use a Smart Order Router (SOR) . This algorithm slices the parent order into thousands of tiny child orders and sends them to various venues simultaneously—Lit exchanges, Dark Pools, ECNs—to find the best price and the least impact.
This fragmentation is why you see price zig-zagging randomly on a tick chart. It’s not random; it’s just the SOR algorithm hunting for hidden liquidity. It pings the dark pools, checks the ECNs, and reports back.
Part 5: Practical Application—Reading the Tape Like a Pro#
You don’t need a $2,000 a month Bloomberg terminal to apply microstructure. You just need to change how you look at the chart and focus on three things: Price, Volume, and Time.
Step 1: Ignore the Lagging Indicators. Stop looking at 1-minute charts for entries based on lines drawn from last week. Moving averages and oscillators tell you what happened. Order flow tells you what is happening now. Prioritize raw data.
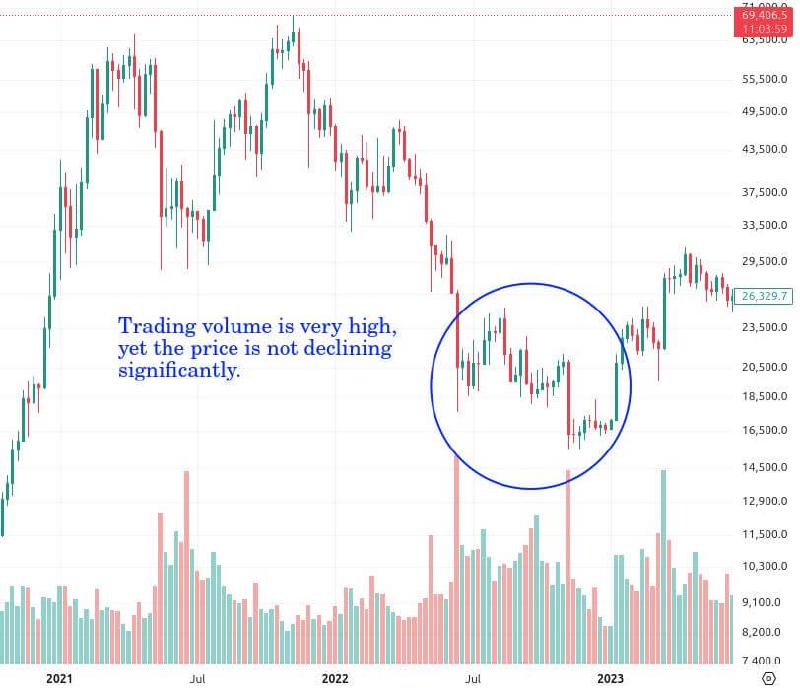
Step 2: Look for Absorption. Absorption is the holy grail of microstructure. It happens when one side is so aggressive that it cancels out the other side, preventing price movement.
- Bullish Absorption: Price tries to go down. Sellers are aggressive. But volume spikes and price refuses to follow through lower. It just sits there, churning. This means buyers are stepping in and absorbing every single sell order as fast as they appear. The sellers are being exhausted. When you see absorption at support, get ready to go long.
- Bearish Absorption: Price tries to go up. Buyers are aggressive. But volume spikes and price stalls, forming a doji or a small body at resistance. Sellers are absorbing the buy orders. Get ready to short.
Step 3: Analyze the “Footprint” Charts (If Available). If you have access to platforms that offer bid/ask volume footprints (like NinjaTrader, Sierra Chart, or ATAS), look for:
- P-bars (Passive bars): When volume is high but price movement is low. This confirms absorption.
- Delta Extremes: When Delta reaches a multi-day high, it often signals a temporary climax. The buyers are exhausted; a pullback is due.
Step 4: Identify the “Fat Finger” or “Grab.” Check the wicks on higher timeframes (15min, 1hr). Look for a sudden, sharp move that immediately reverses. That wick represents a liquidity void—an area where price moved so fast that resting orders couldn’t get filled. Price often returns to these areas to “retest” the liquidity. These are high-probability reversal zones.
Part 6: The Microstructure Cheat Sheet#
To summarize, here is a quick reference guide for decoding market movements in real-time:
- Wide Spread + Low Volume: The market is asleep. Institutions are on a coffee break. Avoid trading (lunch time, pre-market, holidays).
- Narrow Spread + High Volume: The market is liquid and competitive. Institutions are present and active. This is your ideal trading environment.
- Price Rising Slowly on Low Delta: Retail driven, weak move. Likely to fail at the next resistance.
- Price Rising Steadily on High Delta: Institutional buying. Strong trend. Look for pullbacks to enter.
- Price Tanks Through Support but Immediately Recovers (Wick): Classic stop hunt. Look for long entries on the retest.
- Price Spikes Through Resistance but Immediately Reverses (Wick): Bull trap. Look for short entries.
- High Volume + No Price Movement: Absorption is happening. The market is coiling for a big move, but the direction is unknown until one side wins. Stay out until price breaks.
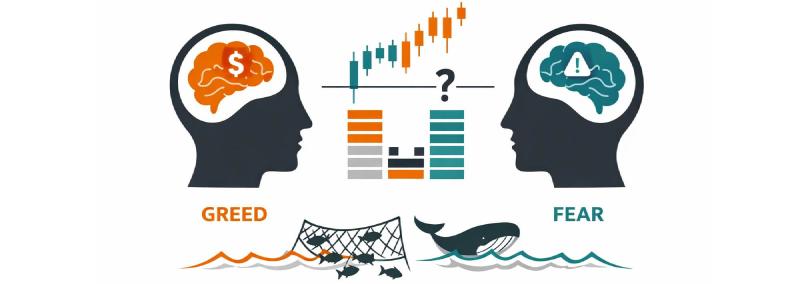
Part 7: The Psychology of Microstructure#
Finally, remember that behind the algorithms and the order flow are human beings (or humans coding AI). Their primary emotions are greed (wanting to buy) and fear (wanting to sell).
Market microstructure is essentially the study of how these emotions are translated into actual transactions. The massive bid wall isn’t just a number; it represents a pool of capital from managers who think the price is cheap. The stop-run through support isn’t just a chart pattern; it’s the algorithmic exploitation of retail traders’ fear of losing more money.
By understanding microstructure, you understand the game. You realize that the market is not a passive mechanism for price discovery; it is an active, living ecosystem where the big fish use the rules of the game to eat the small fish.
Your goal is no longer to be the small fish guessing where the next crumb will fall. Your goal is to swim alongside the whales, riding the currents they create, and avoiding the nets they set for the unwary.
The psychological dimension—understanding how your own mind reacts to these institutional maneuvers—is critical. For a complete guide to the cognitive biases that make retail traders vulnerable to stop hunts and liquidity traps, see 7 Cognitive Biases That Are Secretly Draining Your Trading Account.
Conclusion: Think Like a Venue, Not a Victim#
Most retail traders treat the market as a vending machine—they put money in and expect a soda to come out. When it doesn’t, they kick the machine.
Market microstructure teaches you that the market is actually a chaotic bazaar where everyone is trying to get the best deal, often at your expense. By understanding liquidity in trading, the mechanics of the order book, and the footprints of institutional order flow, you stop being the tourist who gets pickpocketed while staring at a map. You become the observer who sees the pickpocket coming and follows them to their hidden stash of cash.
The candlesticks are just the story. The order flow is the plot. Start reading the plot, and you will never look at a chart the same way again.
Ready to dive deeper into the world of Smart Money? The next part in our Market Mastery series explores how to visualize these concepts with precision.
[Continue to Part 3: Volume Profile Mastery: Trading the 80% Rule →]