Imagine you’re a detective at a crime scene. You can either stand outside and guess what happened based on the commotion you hear, or you can go inside, dust for fingerprints, and watch the security footage in real-time.
Most retail traders are the former. They look at lagging indicators, delayed charts, and old news.
Prop firm traders are the latter. They watch the tape.
Order flow trading is the art and science of analyzing the real-time transactions happening in a market. It’s the difference between trading a story and trading the actual data. In this guide, you will learn exactly how to read the tape, interpret the Depth of Market (DOM), and use tools like cumulative delta to find institutional entries—just like the pros.
What is Order Flow Trading? (Seeing the Market’s Engine)#
Imagine you are watching a football game on TV. The camera is high up, showing you the whole field. You can see the score and the positions of the players, but you have no idea what’s being said in the huddle or who is injured.
That’s how most people trade, using standard charts.
Now, imagine you are the coach on the sidelines. You can hear the players breathe, you see the quarterback point to a specific receiver, and you know exactly which play is coming next.
That is order flow trading.
It is the practice of looking at the raw, real-time data of every single transaction happening in the market. Think of it as looking directly at the market’s engine while it’s running, instead of just looking at the speedometer (which is what price charts show you).
The “Fingerprint” of Money#
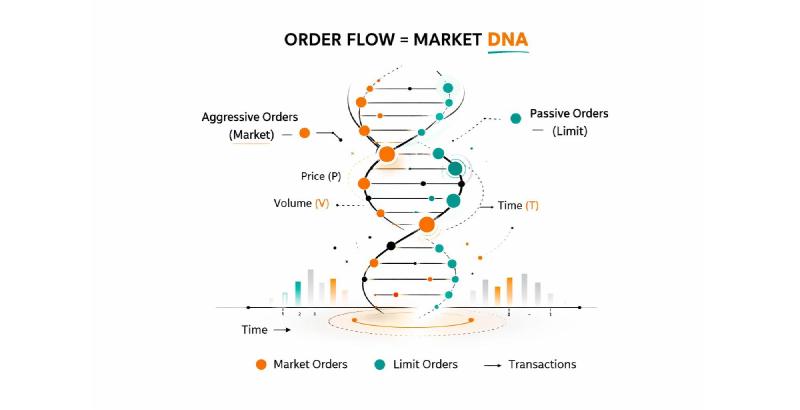
Every time someone buys and someone sells, a “print” is created. This print tells you four specific things:
- Price: How much did they pay?
- Volume: How many shares or contracts did they trade? (Was it a regular person, or a big institution?)
- Time: Exactly when did it happen?
- Aggression: Did the buyer grab the price immediately (aggressive), or did they place a slow, waiting order (passive)?
This data is the raw DNA of market movement. By reading it, you aren’t guessing what big money might do; you are watching what they are doing right now.
Why Regular Charts Are Like Reading Yesterday’s News#
If order flow is so great, why doesn’t everyone use it? Most traders rely on standard charts and indicators because they are simple. However, they have a major flaw:
- They are Slow: Indicators like RSI or MACD are based on past data. They tell you where the price has been, not where it’s going. It’s like driving a car by only looking in the rearview mirror.
- They Hide the Truth: Imagine you see a big, green candle stick on your chart. It looks strong! But here is the catch: that candle could have been created by one single, massive buyer. Or, it could have been created by thousands of tiny, nervous buyers. You have no way of knowing which one is true from the candle alone. We call this the “Ghost” of Value—the chart shows a ghost, but order flow shows the real body.
The Secret Weapon of the Pros#
Proprietary trading firms (the companies that trade with their own money) don’t win because they have magic charts. They win because they watch the “tape” (another word for order flow). They see the footprints of the “whales” (big institutional investors) before the rest of the crowd catches on.
Order flow turns your computer screen into a high-powered microscope. It lets you see the microscopic battle between buyers and sellers at every single price level. This gives you a timing advantage that regular price charts simply cannot provide. You stop hoping for the market to move, and you start knowing why it is moving.
The Core Tools of a Tape Reader (And How Smart Money Hides)#
To read the tape effectively, you need the right tools. But here is the most important lesson in this entire guide: the tools don’t show you the truth; they show you clues.
If you look at a Depth of Market (DOM) screen and think, “Wow, a big bid wall! The price will never go below that!”, you are exactly the kind of trader the algorithms want to trap.
Smart money sees your stop loss sitting just below that wall, and they might just push the price through it to grab your shares before reversing. They can also hide their own orders using tactics like icebergs.
So, as we go through these tools, remember: we are not looking for certainty. We are looking for imbalance and deception. We are looking for what isn’t being shown.
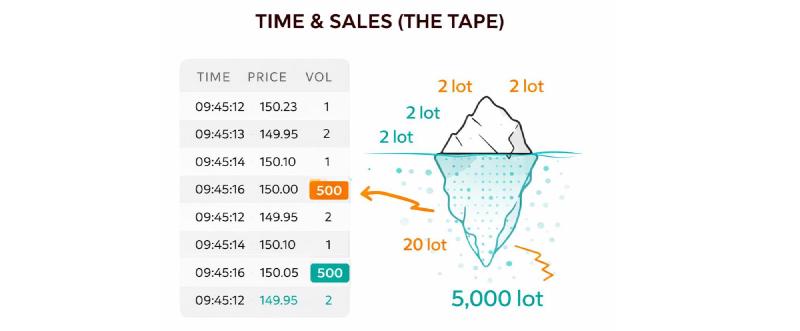
1. Time & Sales (The Tape)#
This is the most basic tool. Think of it as the market’s receipt. It’s a simple list of every single transaction that has occurred. It shows you:
- Time: Exactly when the trade happened.
- Price: The agreed-upon price.
- Volume: How many shares or contracts were traded.
How to Read It: The key is to watch for abnormal prints. A constant stream of 1 or 2-lot trades is usually retail noise. Suddenly seeing a 500-lot print hit the bid is a signal that a larger player is active.
The Trap: However, smart money knows you are watching. They can break up a massive 5,000-lot order into 50 smaller 100-lot orders and drip them into the tape over several minutes. This is called “iceberg-ing” their prints. You might not see the 500-lot “bomb,” but you might see a persistent, heavy stream of 20-lot prints that never stops, even as price goes up. That repetitive pressure is the clue.
2. Depth of Market (DOM) / Level 2#
If Time & Sales is the history book, the DOM is the future forecast. It shows you all the pending limit orders waiting to be executed.
- The Bids: Limit orders to buy, stacked on the left.
- The Asks: Limit orders to sell, stacked on the right.
How to Read It: The DOM allows you to gauge liquidity. You can see where the “walls” are—large resting orders. A naive trader sees a massive bid wall at $100.00 and thinks, “Strong support!”
The Trap (This is critical): That big bid wall you see at $100.00? It might be a trap. Smart money can place those orders to make it look like there is support, enticing you to buy. But the moment price gets close, they can yank those orders (a tactic called “pulling liquidity”) and then sell into the buying pressure they just created. Alternatively, they may want to trigger a sell-off, so they will purposely push price through a known support wall to hit all the stop losses sitting below it.
- The Rule: Don’t trust the walls; watch how the market reacts to them. Does the bid wall hold and absorb selling pressure? Or does it disappear the moment it’s tested?
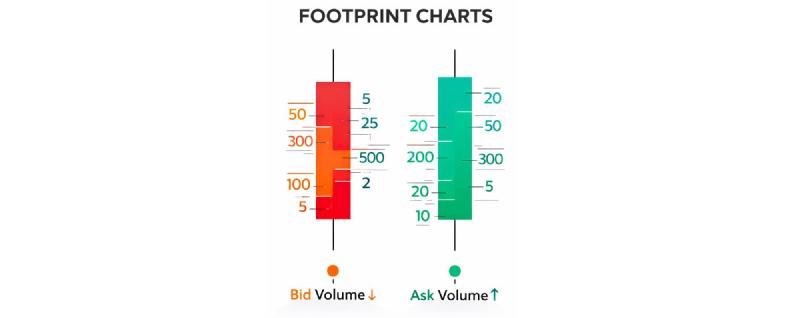
3. Footprint Charts#
This is your lie detector. A footprint chart takes every transaction from Time & Sales and organizes it inside each candlestick. It literally shows you the volume traded at each price level.
- Bid Volume: Volume that was initiated by sellers (aggressively hitting the bid).
- Ask Volume: Volume that was initiated by buyers (aggressively lifting the offer).
How to Read It: By comparing Bid vs. Ask volume within a bar, you can see the truth. A candle might close red (price went down), but if the Footprint shows massive Ask volume (buying) at the bottom of that red candle, it reveals a lie. It shows that buyers were stepping in even as price was falling—a sign of a potential reversal.
Why it beats the tricks: While smart money can hide orders on the DOM and break up prints on Time & Sales, they cannot hide the aggression of their execution. When they finally decide to buy, they have to lift offers. That volume shows up in the “Ask Volume” of a Footprint chart, no matter how they slice it. The Footprint shows you the result of their actions, which is the closest thing to a fingerprint they leave behind.
Step-by-Step: How to Read the Tape Like a Pro#
Now that you understand the tools and their limitations, let’s put them into practice. A prop firm trader doesn’t just look for big green bars or big bid walls. They look for a story. They ask: Who is in control? Is the buyer desperate, or patient? Is that support level real, or is it a mirage designed to trap me?
Here is the step-by-step mental model for analyzing order flow with a skeptical, professional eye.
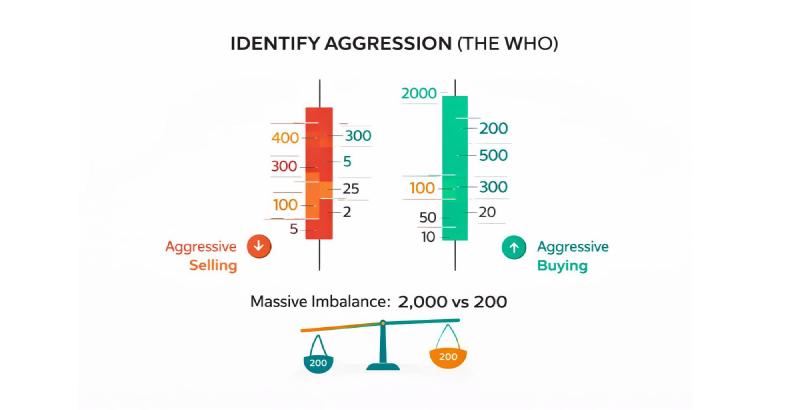
Step 1: Identify the “Footprint” of Aggression (The Who)#
The most important concept in order flow is aggression. This tells you who is initiating the trade.
- Aggressive Buying: A trader uses a market order to lift an offer. They want in now, no matter the cost. This prints on the Ask side of the footprint.
- Aggressive Selling: A trader uses a market order to hit a bid. They want out now. This prints on the Bid side of the footprint.
Your goal is not just to see aggression, but to look for imbalance. If you see a bar on the footprint where the Ask volume is 2,000 and the Bid volume is 200, that is a massive imbalance. Aggressive buyers are in control. This is known as “Buying Excess.”
However, don’t just buy the first imbalance you see. Ask yourself:
- Is this aggression absorbing the passive sellers, or is it running into a massive wall of limit orders?
- Is this a one-bar wonder, or is the aggression sustained over multiple bars?
A single spike of buying in a downtrend is often a trap—a “dead cat bounce.” Sustained buying absorption is the real signal.
Step 2: Analyze the DOM for Traps and Truth (The Where)#
The DOM shows you where liquidity is resting. But as we learned, big liquidity can be a lie. Here is how to read it for truth:
- Look for the “Sticky” Wall: Is a large bid wall sitting there passively, or does it keep pulling away as price approaches? A wall that holds steady and gets tested repeatedly is more significant than a wall that flickers in and out. If price approaches a bid wall and the wall holds firm, absorbing selling pressure, that is a sign of strength.
- Spot the Iceberg: You might see a bid of 50 at a level, but every time it gets hit, a new 50 bid appears immediately, like magic. This repetition is a sign of an Iceberg Order. It indicates a large player is quietly accumulating or distributing without showing their full hand. The market is being held up (or held down) artificially.
- Watch for Stop Hunts (The “Spring”): You will often see the DOM get very thin just above a high or below a low. Algorithms push price into this thin air, triggering stop-loss orders. This creates a quick, sharp spike on high speed but relatively low volume.
The Pro Move: If you see a price spike through a level on thin DOM, do not chase it. Wait. If it reverses just as quickly, you just witnessed a failed breakout—a classic sign of a trap. The true direction is often the opposite of that spike.
Step 3: Read the Cumulative Delta (The Why)#
Cumulative Delta is your “lie detector” for the trend. It is a running total of (Ask Volume - Bid Volume). It tells you if the price movement is genuine.
- Rising Delta + Rising Price = Confirmation: More volume is trading on the Ask. Buyers are in control. The trend is healthy.
- Falling Delta + Falling Price = Confirmation: More volume is trading on the Bid. Sellers are in control. The trend is healthy.
- Divergence (The Magic Signal): This is where you catch the “smart money” reversing their position.
- Bearish Divergence: Price makes a new high, but Delta makes a lower high. The price is going up, but the buying pressure is drying up. Institutions are likely selling into the strength. A reversal is coming.
- Bullish Divergence: Price makes a new low, but Delta makes a higher low. The price is going down, but the selling pressure is vanishing. Institutions are likely buying the dip.
Delta cuts through the noise. It tells you the intent behind the movement, helping you distinguish between a genuine breakout and a liquidity hunt.
Putting It All Together: A Professional Checklist#
Don’t just stare at the screens. Run through this mental checklist before you enter a trade:
- Bias (The Big Picture): What is the trend on the higher timeframe? (We are only looking for entries in this direction).
- The Setup (Price Action): Has price pulled back to a key level (support/resistance, VWAP, moving average)?
- The DOM Trap Test: Is there a liquidity wall at that level? Is it real or does it look like it might be a trap? Is the market “hunting” above or below?
- The Footprint Signal: At the key level, do I see absorption (large Bid volume being met with even larger Ask volume) or exhaustion (price stalling on high volume)?
- The Delta Confirmation: Is Delta diverging from price, suggesting a reversal? Or is it confirming the move, suggesting momentum?
By following this structured approach, you move from guessing to observing. You aren’t hoping the market will go up; you are waiting for the evidence that the “whales” are starting to push it there.
Real-World Trade Example: Reading the Tape in Action#
Let’s walk through a hypothetical but realistic trade using order flow.
The Setup: ES (S&P 500 E-mini Futures) has been in a steady uptrend all morning. Price pulls back to a previous resistance-turned-support level at 4,500.
The Observation:
- DOM Analysis: You look at the DOM and see a massive bid wall of 1,000 contracts sitting at 4,499.50. The offers above are thin.
- Time & Sales: As price approaches the 4,500 level, you see large 200-lot and 300-lot prints starting to hit the bid. Sellers are trying to push through, but the bid wall at 4,499.50 is holding.
- Footprint Confirmation: You check a 1-minute footprint chart. The bar that touched 4,500 shows a massive spike in Bid volume (sellers hitting the bid), but the bar didn’t close lower. In fact, the very next minute, the Ask volume explodes. The Bid volume was absorbed, and now buyers are stepping in aggressively.
- Delta Signal: The Cumulative Delta had been drifting down during the pullback, but at the 4,500 level, it flattens and begins to curl upward aggressively.
The Entry: You see a 50-lot print lift the offer at 4,500.50, easily eating through the thin ask stack. You enter long at 4,500.75, with a stop just below the recent low at 4,499.25 (below the big bid wall).
The Result: Price rockets up. The initial absorption of selling pressure, followed by aggressive buying confirmed by Delta, was your “all-clear” signal. You didn’t buy the pullback hoping it would hold; you bought it because you saw it hold on the tape.
Common Pitfalls in Order Flow Trading (And How to Avoid Them)#
Order flow is powerful, but it’s easy to misinterpret.
Pitfall 1: Mistaking Retail Noise for Institutional Activity#
Not every large print is a “whale.” A 100-lot print in the S&P 500 is significant. A 100-lot print in a thin stock like a small-cap biotech might just be one decent-sized retail trader.
- Fix: Context is everything. Understand the Average Daily Volume of the instrument you are trading.
Pitfall 2: “Paralysis by Analysis”#
With the DOM updating hundreds of times a second and the footprint showing thousands of numbers, it’s easy to get overwhelmed and freeze.
- Fix: Start slow. Focus on just one thing for a week. Spend the first week only looking for Bid/Ask imbalance on the footprint. Add the DOM next week. Master the tools one by one.
Pitfall 3: Ignoring the Higher Timeframe#
Order flow is fantastic for entries, but terrible for direction. You might see beautiful buying pressure, but if you’re trying to go long in a powerful downtrend on the daily chart, you’re likely catching a falling knife.
- Fix: Use swing charts (daily/4-hour) to determine your bias. Then, drop down to the order flow charts (1-minute/5-minute) to find an entry in that direction.
Conclusion: Your Journey from Retail to Prop Firm Trader#
Order flow trading is not a magic button that guarantees profits. It is a skill that requires hours of screen time and deliberate practice. However, it is the single most effective way to bridge the gap between retail guessing and professional execution.
By learning to read the tape, you stop asking “what will happen?” and start observing “what is happening?” You align yourself with the big capital flows rather than fighting against them.
Start by pulling up a Time & Sales window today. Just watch it. Look for the big prints. Look for the speed. Do this for a week while you read more about DOM and Footprint charts. Your trading will never be the same.
Frequently Asked Questions About Order Flow#
Q: Do I need expensive software to trade order flow? A: You can start with basic Time & Sales and Level 2 data provided by most brokers (like Tradovate, NinjaTrader, or Sierra Chart). However, advanced analysis (like footprint charts) typically requires a data package and platform like Sierra Chart, Quantower, or MotiveWave, which can cost a monthly fee.
Q: What markets are best for order flow trading? A: Order flow works best in highly liquid markets where the data is accurate and fast. The most popular are Futures (ES, NQ, CL, GC) and large-cap Stocks. Forex is more difficult due to its decentralized nature.
Q: Is order flow only for day trading? A: Primarily, yes. The data is so granular that it loses its predictive power over long periods (days or weeks). It is predominantly a tool for intraday trading and scalping.
Q: How long does it take to become profitable with order flow? A: There is no set time. It depends on your dedication. Many traders report that it takes 6–12 months of consistent screen time to become truly proficient at reading the tape without hesitation. It is a journey of building market intuition.