What This Post Delivers#
What if everything you’ve been taught about technical analysis is backward?
Not slightly off. Not in need of optimization. Structurally, fundamentally backward.
You’ve spent months—maybe years—mastering moving average crossovers, RSI divergences, and head-and-shoulders patterns. Yet your P&L still looks like a hospital heart monitor flatline.
Why?
Because you’ve been taught to study the result of trading (price) while remaining blind to its cause (institutional order flow). You’re reading yesterday’s newspaper in a market that moves in milliseconds.
By the time your indicators flash “buy,” the smart money has already filled their orders. By the time your pattern completes, you’re not entering a trade—you’re volunteering to be someone else’s exit liquidity.
This post exposes the five structural flaws in conventional TA that no course talks about. Read it if you’re brave enough to question whether your charts have been lying to you.
Spoiler: They have.
If you have spent any time in the financial markets, you know the drill. You master the Moving Average Crossovers, you wait for the RSI to dip below 30, and you can spot a “Head and Shoulders” pattern from across the room.
Yet, despite all that charting knowledge, your profit and loss statement remains stubbornly stagnant—or worse, in the red.
You are not alone. Thousands of traders fall into the same trap. They believe that if they just find the perfect indicator settings, the market will finally unlock its secrets.
The hard truth is this: Technical Analysis (TA), as most retail traders use it, is a broken compass. It points to where you have been, not where you are going.
In this post, we will dissect the five critical reasons why conventional TA fails. More importantly, we will pull back the curtain on what institutional traders and professionals use instead to gain a real, consistent edge in the markets.
The Indicator Mirage: Why Your Charts Aren’t Making You Money#
To fix your trading, you must first understand the flaw in your tools. Most retail traders operate under a false assumption: that price moves because of indicators.
Price does not move because the RSI is “oversold.” Price moves because massive buying and selling pressure enters the market.
Technical analysis is simply a visual representation of past activity. It is like trying to navigate a car by looking only in the rearview mirror. You can see where you have been with perfect clarity, but you have zero information about the bend in the road ahead.
Let us look at the five specific reasons this approach keeps traders trapped in a cycle of losses.
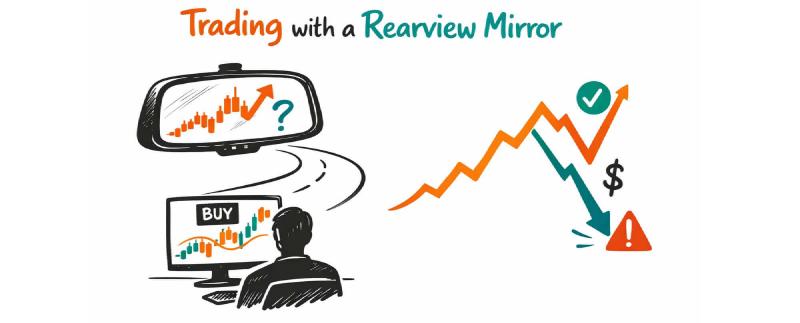
Reason #1: You’re Trading with a Rearview Mirror (The Lag Factor)#
This is the most fundamental flaw of traditional technical analysis. Indicators like Moving Averages, MACD, Bollinger Bands, and Stochastics are lagging indicators.
- How they work: They take historical price data, run it through a mathematical formula, and plot the result.
- The problem: By the time the formula generates a signal, the price move has already happened.
Imagine a moving average crossover signaling a “buy.” For that crossover to occur, price had to move significantly in one direction first. You are essentially being told to buy after a rally has already taken place.
The Result: You enter late, your stop loss is wide, and you are perfectly positioned for the smart money to “distribute” their holdings to you right before the trend reverses. You are not analyzing the market; you are reacting to it.
For a complete framework that replaces lagging indicators with causal market analysis, see The 3 Pillars of Professional Trading, where we introduce the Market Ecosystem view and institutional order flow concepts.
Reason #2: Drawing Lines in Shifting Sand (The Subjectivity Problem)#
Markets are supposed to be about objective data. However, traditional TA is deeply subjective.
Consider a simple task: drawing a trendline.
- Trader A draws a line connecting the lows from three weeks ago.
- Trader B draws a line connecting the bodies of the candles, ignoring the wicks.
- Trader C draws a line connecting the wicks, believing they represent true liquidity.
All three traders are looking at the exact same chart, yet they have three different definitions of the current trend. The same applies to chart patterns. Is that a Bull Flag or is it just a consolidation before a breakdown? Is that a Double Bottom or a pullback before new lows?
The Result: This subjectivity creates analysis paralysis. You waste hours trying to decide which interpretation is “correct.” And when you finally do pick a side, you lack the confidence to hold the trade because you know deep down it was just your opinion against the market’s.
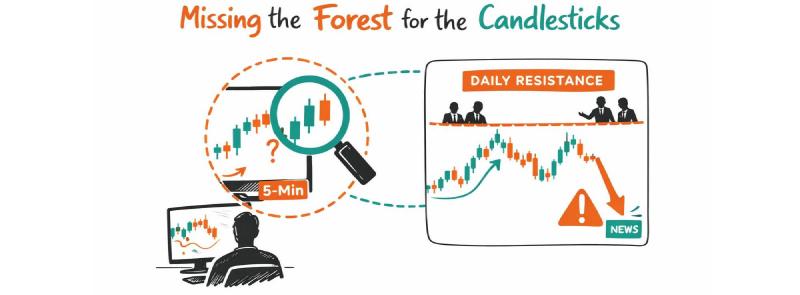
Reason #3: Missing the Forest for the Candlesticks (Context Blindness)#
Most retail traders are glued to low timeframes. They watch a 5-minute or 15-minute chart, looking for small opportunities. In doing so, they completely ignore the broader market context.
This is known as “Context Blindness.”
- You see a beautiful bullish engulfing candle on the 5-minute chart.
- You enter long, excited by the signal.
- You get stopped out immediately.
- Why? Because that 5-minute signal occurred directly below a major daily resistance level, or during a news event where institutions were aggressively selling.
The Result: A TA signal is never valid in a vacuum. If you ignore the “higher timeframe” structure, key support/resistance zones, and the current market environment (trending vs. ranging), you are trading blind. You are taking a tiny piece of data and ignoring the massive picture that gives it context.
This multi-timeframe context is a core component of Market Mastery. Learn how to build falsifiable theses using higher-timeframe structure in Why Your Trading Thesis Is Probably Wrong.
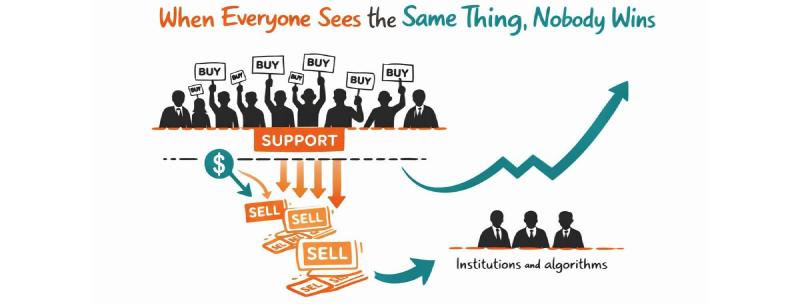
Reason #4: When Everyone Sees the Same Thing, Nobody Wins#
There is a popular defense of technical analysis: “It works because it’s a self-fulfilling prophecy.” The idea is that if enough traders see the same support level, they will all buy there, creating demand and pushing price higher.
This logic holds up… until it doesn’t.
The problem is that institutions and algorithms know exactly where the retail crowd is looking.
- If everyone has a stop loss below a popular support level, institutions know that if they push price down there, they will trigger a cascade of sell orders (liquidity).
- They can then use those sell orders to fill their own buy orders at a discount.
The Result: You get “stopped out” right before the market reverses and goes up. The levels that look obvious on a chart are often the most dangerous places to enter a trade because they are liquidity traps set by the larger players.
To understand exactly how institutions exploit retail liquidity—including iceberg orders, stop hunts, and dark pools—read Market Microstructure Decoded: How Institutions Really Move Prices.
Reason #5: Analyzing Ghosts Instead of Footprints (Ignoring Order Flow)#
This is the ultimate limitation of standard technical analysis. TA looks at the result of trading (price). It ignores the cause of trading (order flow).
When an institution wants to buy 10,000 shares of a stock, they don’t just hit the “buy” button at the current price. That would spike the price against them. They execute complex algorithms to hide their footprint.
Standard TA is completely blind to this process. It cannot tell you:
- Where are the large, resting limit orders?
- Is the buyer or the seller currently in control of the tape?
- Is volume increasing at a specific price level, indicating institutional interest?
The Result: You are trading a shadow. You see the price moving, but you have no idea why. Without understanding the underlying pressure, you are guessing. It is like diagnosing a car engine problem by only looking at the speedometer. You know something is wrong, but you have no clue where to fix it.
Level Up: 3 Tools Professional Traders Use for a Real Edge#
If you take away the lagging indicators and the subjective patterns, what is left? The answer is Price Action and Market Structure.
Professionals focus on the raw data: the movement of price and the liquidity left behind by other traders. Here is what they use instead of standard TA.
1. Market Structure Analysis#
Instead of looking at squiggly lines (indicators), professionals look at the swing points on the chart.
- Higher Highs & Higher Lows: Defines an uptrend.
- Lower Highs & Lower Lows: Defines a downtrend.
- Break of Structure (BOS): When price breaks a recent swing high/low, confirming the trend is continuing.
- Change of Character (CHoCH): When price breaks the structure of the trend, signaling a potential reversal.
This is objective. Price either breaks a level or it doesn’t. There is no subjectivity, and no lag. It tells you right now if the market’s internal dynamics are shifting.

2. Liquidity Concepts#
Markets move to seek liquidity. Stops and limit orders act like magnets for price.
- Sweeping Lows: Professionals look for price to dip just below an old low to trigger all the retail stop losses, then reverse instantly.
- Equal Highs: A double top isn’t just a pattern; it is a zone of trapped longs waiting to break even.
By understanding where the liquidity sits, you can predict where price is likely to go next. You stop asking “what if it goes up?” and start asking “where are the stops?”
3. Volume Profile (Market Profile)#
If you have access to it, Volume Profile is superior to standard volume indicators. Instead of a single bar at the bottom, Volume Profile shows you how much volume traded at specific price levels.
This reveals:
- High Volume Nodes (HVN): Areas of agreement where price traded heavily. Often act as support/resistance or magnets for price to return to.
- Low Volume Nodes (LVN): Areas where price moved quickly. Price tends to move rapidly through these zones.
This gives you a three-dimensional view of the market, showing you exactly where the big players have placed their bets.
The Final Verdict: Should You Burn Your Indicator Books?#
No. You don’t need to burn your books. But you do need to change your hierarchy.
Stop placing lagging indicators at the top of your analysis pyramid. They should be the last thing you look at, if you look at them at all.
- Start with Structure: Is the market trending or ranging?
- Identify Liquidity: Where are the stop hunts and the major player entries?
- Use Price Action: Look at the raw candles for confirmation of intent.
- Consider TA (Optional): Only then, look to see if your old indicators align with the institutional footprint you have identified.
The goal is to stop being a reactive indicator trader and start being a proactive market structure analyst. When you shift from looking at the “ghosts” of past price to the “footprints” of current order flow, your trading will never be the same.
Ready to Ditch the Lag and Trade with the Flow?#
If you are tired of lagging indicators and want to master the institutional strategies covered in this post, you are in the right place.
This article is Part 1 of the Market Mastery Deep Dive series. We have laid the foundation by exposing the flaws in conventional thinking.
Next up: We will dive deep into the mechanics of how institutions actually move price.